

By Michael Nielsen, Publisher | 15+ Years in Diesel Repair & Fleet Operations
Last Updated: September 2026
⏱ Estimated reading time: 15 minutes
Fleet total cost of ownership represents far more than a purchase price and a fuel card statement — it's every dollar a vehicle consumes from acquisition through disposal, and most fleets are only tracking part of that picture.
Vendor-sponsored research published in 2026 surveying fleet professionals found nearly 90% express moderate-to-high confidence in their cost tracking, yet many of those same fleets still manage costs across disconnected spreadsheets, fuel systems, and maintenance software that never talk to each other. That gap between confidence and connected data — not a lack of information — is where hidden fleet expenses live.
This guide breaks down the cost categories most fleets under-measure — administrative overhead, unplanned downtime, and accident costs chief among them — along with current industry benchmarks, lease-versus-own math, and the technology fleets are using to close the visibility gap.
Key Takeaways
- ✓The real gap is connectivity, not confidence. Most fleets already feel confident in their cost tracking — the actual problem is that fuel, maintenance, and telematics data live in separate systems that never reconcile in real time, hiding the relationships that explain why costs move.
- ✓Downtime and administrative overhead are the two costs fleets see least clearly — a repair invoice is easy to track, but what it costs to have that vehicle out of service rarely gets measured at all.
- ✓Leasing runs roughly 19% cheaper per mile than ownership on average ($0.65 vs. $0.80, per Ryder's fleet TCO analysis), but that gap depends heavily on utilization, in-house maintenance capability, and how long you actually plan to keep the asset.
- ✓A single commercial vehicle crash carries a heavier price tag than most budgets assume — FMCSA's current crash-cost methodology puts a non-injury large-truck crash at roughly $49,400, an injury crash at roughly $326,800, and a fatal crash at roughly $15.2 million once every economic cost is included.
In This Guide
- Understanding Fleet Total Cost of Ownership
- Hidden Fleet Expenses Draining Your Budget
- Strategic Acquisition and Upfitting Decisions
- Operating Costs: Fuel, Maintenance, and Daily Expenses
- Fleet TCO Benchmarks by Industry Segment
- Lease Versus Ownership: Financial Analysis
- Leveraging Technology for TCO Optimization
- Future-Proofing Fleet Operations
- Frequently Asked Questions
Understanding Fleet Total Cost of Ownership
Fleet total cost of ownership (TCO) is the sum of every financial commitment tied to a vehicle from acquisition through disposal — not just the number on the purchase invoice. Michael Nielsen has made this point to HDJ readers repeatedly over the years: the purchase price typically accounts for only 10–15% of a vehicle's total lifecycle cost, and fleets that budget as though it's the whole story are the ones most likely to get surprised three or four years in.
The rest accumulates across financing, fuel, maintenance, insurance, administration, and eventual resale in ways that surface-level tracking routinely misses. The TCO formula combines acquisition price, operating expenses, maintenance costs, depreciation, and residual value at disposal.
Capital costs include dealer pricing, taxes, registration, financing charges, and upfitting specific to the vehicle's job. Operating expenses — fuel, routine repairs, insurance, licensing, and compliance — recur for the vehicle's entire service life and frequently exceed the original purchase price well before the vehicle is retired.
The Argonne National Laboratory's Economic Analysis of Vehicle Technologies research, funded by the U.S. Department of Energy's Vehicle Technologies Office, addresses a gap standard TCO approaches miss entirely: for medium- and heavy-duty vehicles specifically, Argonne's analysis finds that added battery weight can meaningfully reduce available payload capacity, and that electric vehicle charging time — valued at driver labor rates — can become a significant, easily overlooked share of total cost.
Those factors matter increasingly as fleets weigh diesel against battery-electric or fuel-cell options, where the sticker-price comparison alone tells only part of the story.
Depreciation and Residual Value
Depreciation is the single largest cost category for most fleets — a vehicle commonly retains only about 20% of its original value after five to six years, meaning 80% of the original purchase price has already evaporated by the time many fleets consider replacement.
That erosion demands attention at both ends of ownership: overpaying at acquisition compounds the loss, and misjudging disposal timing means selling into a steeper part of the depreciation curve than necessary. HDJ's fleet lifecycle management guide walks through where that depreciation curve actually bends by vehicle class, if you want to time a disposal decision against your own fleet's numbers.
Administrative overhead is the quieter cost category hiding next to depreciation — management time allocated to fleet oversight, software subscriptions, compliance documentation, and vendor coordination. It's exactly the kind of line item that goes untracked because no single invoice captures it, and it's worth tracking as its own metric rather than folding it invisibly into "overhead."
Hidden Fleet Expenses Draining Your Budget
Hidden fleet expenses concentrate in the categories that don't generate a clean invoice: administrative burden, unplanned downtime, and accident costs. Fleets can typically tell you precisely what a repair costs, but rarely what it costs to have that vehicle sitting out of service. Downtime delays service calls, disrupts routes, and reduces the productivity of an entire crew waiting on one asset, and none of that shows up on the repair invoice itself.
Administrative and Operational Overhead
Administrative overhead consumes real resources most fleets never formally budget for: scheduling activity, compliance paperwork, vendor coordination, and the fleet management software subscriptions layered on top of direct operating costs. Smaller fleets carry a disproportionate share of this burden — without the bulk-purchasing leverage or dedicated fleet staff larger competitors have, they pay elevated per-unit costs for financing, parts, insurance, and administrative support across a smaller vehicle count to spread it over.
Unplanned Maintenance and Downtime Expenses
Unexpected maintenance events cost far more than the repair line item suggests once lost productivity, substitute-vehicle rental rates, disrupted delivery schedules, and missed revenue are added in. Preventive maintenance compliance is the strongest lever fleets have against this exposure — per ATRI's 2026 cost data, repair and maintenance now runs roughly $0.215 per mile industry-wide, and that figure climbs sharply for older, under-maintained equipment relative to a well-maintained unit in its first five years.
$448–$760
Widely cited estimated daily revenue loss per vehicle during unplanned downtime, originating from an Element Fleet Management roundtable discussion reported by Fleet Maintenance trade media — before towing, substitute-vehicle rental, or missed-delivery costs are added. Treat it as a directional benchmark rather than a rigorously sourced statistic; no updated methodology or sample size is publicly documented.
Downtime costs multiply once the full opportunity cost is counted: expedited shipping fees, overtime labor, customer-satisfaction damage, and in some cases contract penalties compound the financial hit well beyond the shop's repair estimate. These cascading effects can outlast the repair itself, damaging customer relationships that took years to build.
Collision and Accident-Related Costs
Vehicle accidents are a hidden cost category most fleet managers underestimate — and the true price tag is steeper than the body-shop bill suggests. Per FMCSA's current crash cost methodology (published February 2026, using 2023 crash data), a non-injury large-truck crash averages roughly $49,400, an injury crash roughly $326,800, and a fatal crash roughly $15.2 million once economic and societal costs are combined.
Beyond direct repair and injury costs, fleet managers absorb legal fees, insurance deductibles, post-claim premium increases, lost management time, and driver-replacement and training expenses that rarely make it into a per-incident cost estimate.
Strategic Acquisition and Upfitting Decisions
Strategic acquisition decisions set a vehicle's financial trajectory for years, and every procurement choice creates ripple effects across residual value and operating cost. Dealer-advertised pricing is only a starting point — manufacturer incentives, volume discounts, regional promotions, and fleet-specific programs are all worth negotiating before accepting a sticker price, and tax rates and environmental fees vary enough by jurisdiction to meaningfully change a final acquisition cost.
Customization requirements vary dramatically by vehicle class and application. Basic modifications like ladder racks or storage inserts represent minimal investment, while sophisticated systems — refrigeration units, hydraulic lifts, specialized equipment mounts, advanced communication systems — can exceed $50,000 per unit. Excessive customization accelerates depreciation and narrows the pool of buyers at resale, while standardizing configurations across the fleet simplifies maintenance, reduces parts inventory, and improves technician efficiency through familiarity.
Operating Costs: Fuel, Maintenance, and Daily Expenses
Operating costs — the expenses that recur every week a vehicle is in service — determine long-term fleet financial health more than the acquisition decision ever does, since they accumulate across the entire ownership period rather than landing as a single upfront number.
Fuel remains the most volatile category: per the American Transportation Research Institute's 2026 Analysis of the Operational Costs of Trucking, the industry-average cost to operate a truck reached $2.336 per mile in 2025 — the highest in the report's history — with fuel running approximately $0.48 of that total.
Vehicle specification choices at acquisition (engine sizing, transmission selection, aerodynamic packages, adaptive cruise control) measurably affect that fuel line for the vehicle's entire life, and telematics-based driver coaching commonly improves efficiency by 10–15% in well-managed operations.
Maintenance Cost Trends and Preventive Strategies
Maintenance splits into predictable scheduled service and unplanned emergency repair, and the gap between the two is widening. ATRI's 2026 data puts repair and maintenance at roughly $0.215 per mile as of the 2025 reporting year, up 8.6% year over year — among the fastest-growing line items in the industry's cost stack. Moving from reactive to preventive maintenance strategies commonly reduces repair spend by a significant margin, and improving PM compliance meaningfully reduces breakdown frequency.
Since preventive maintenance compliance is the single strongest lever against escalating repair costs, here's a field-tested reference worth keeping on hand:
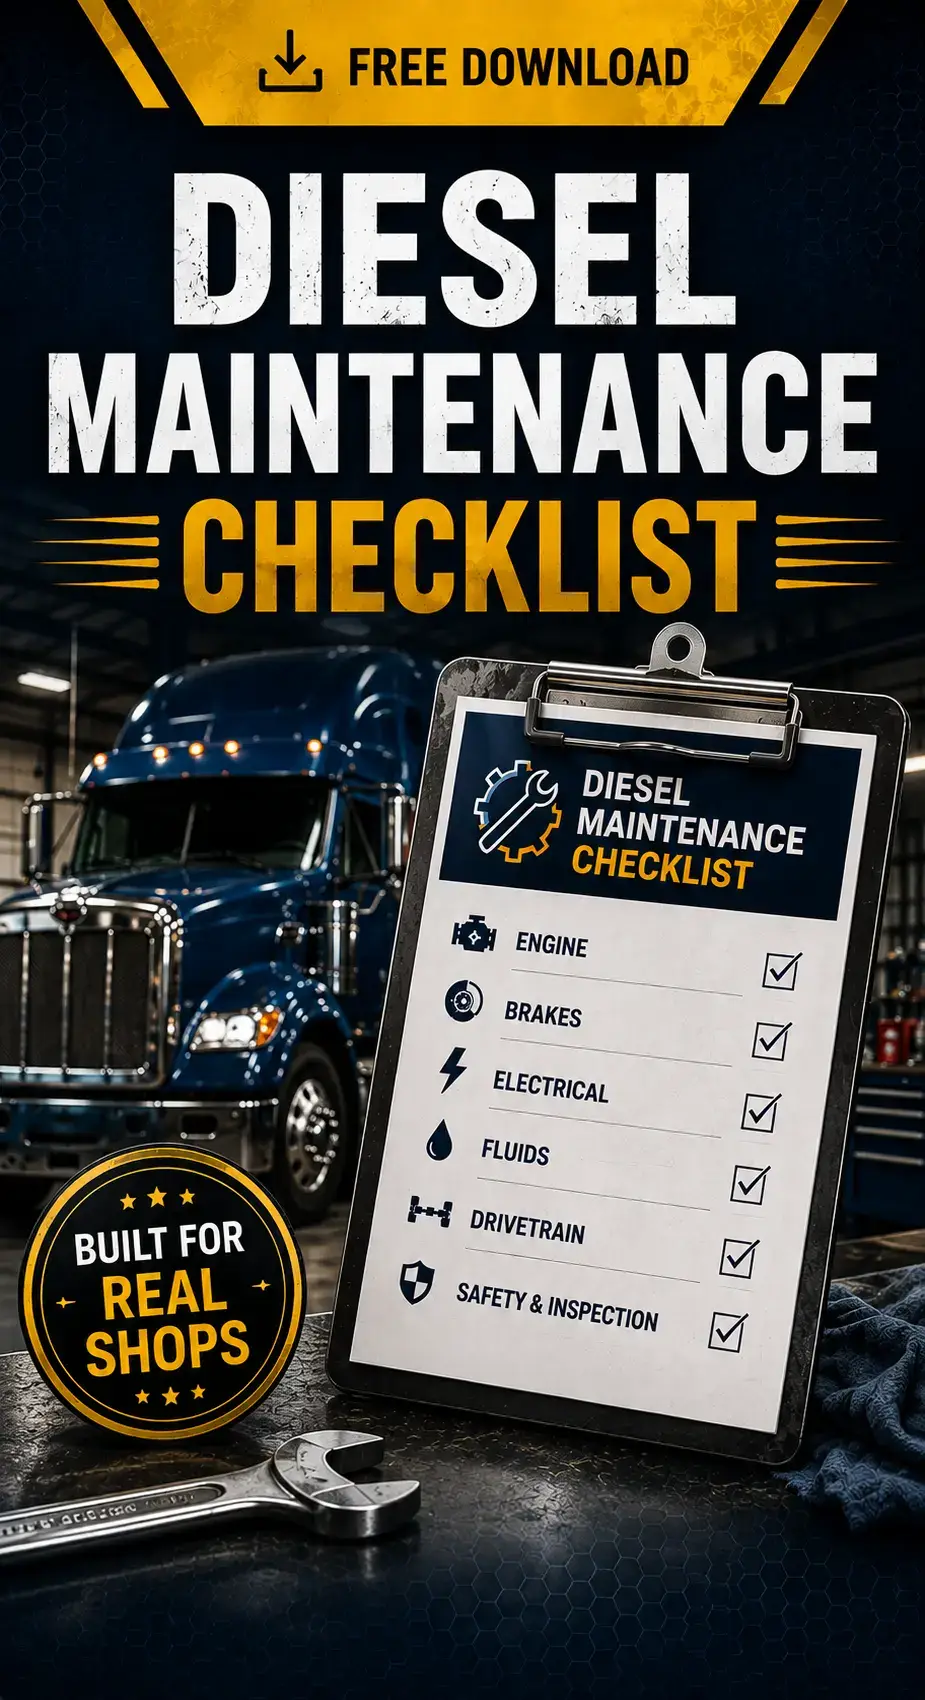
Free Diesel Maintenance Checklist
Get HDJ's free, field-tested diesel maintenance checklist delivered instantly to your inbox — print it, laminate it, keep it in the shop.
Instant PDF • 100% Free • No Spam
Building a PM Compliance Program That Actually Sticks
A checklist only pays off if compliance is tracked, not just handed out.
Fleets that see real results from preventive maintenance typically pair a standardized checklist with three things: a defined completion window (commonly within 10% of the scheduled interval, rather than "whenever the bay opens up"), a digital or paper trail that makes missed services visible to a manager rather than only to the technician who skipped one, and a monthly review that catches drift before it becomes a pattern across the fleet.
None of that requires expensive software — a spreadsheet with dates and a designated reviewer accomplishes the same thing for a small fleet that a full CMMS does for a large one; what matters is that someone is actually looking at the compliance rate on a fixed schedule, not just assuming the checklist is being followed because it exists.
Insurance, Licensing, and Recurring Costs
Insurance premiums vary based on vehicle type, driver records, operating geography, coverage levels, claims history, and documented fleet safety programs. Day-to-day expenses extend well past fuel and repairs into tolls, parking, licensing renewals, registration updates, safety inspections, and other compliance costs that rarely get their own line item in a budget spreadsheet.
The Department of Energy's Vehicle Cost Calculator offers a free reference point for comparing total ownership cost across fuel types and configurations, useful for spot-checking whether an individual asset's cost profile is drifting from what the rest of the fleet is experiencing.
Fleet TCO Benchmarks by Industry Segment
Fleet TCO benchmarks vary considerably by industry segment, and comparing your own numbers against the wrong reference point produces meaningless conclusions. Heavy-duty trucking operations sit at the top of the cost spectrum: ATRI's 2026 report puts the industry-average all-in cost of operating a truck at $2.336 per mile in 2025, the highest figure in the report's history, reflecting driver compensation, fuel, maintenance, equipment payments, and every other operating category combined into one per-mile number.
Lighter-duty service, construction, and utility fleets operate at a different scale entirely, typically measured in cost per mile in the tens of cents rather than dollars, since these vehicles generally log fewer annual miles and carry less specialized equipment than a long-haul tractor.
The gap between vehicle classes is exactly why benchmarking requires matching segment to segment — a utility fleet running aerial lifts and generators will never match a parcel van's cost-per-mile profile, and neither should be judged against the other.
| Fleet Segment | Relative Cost Profile | Primary Cost Driver |
|---|---|---|
| Service & Construction Fleets | Lowest of the segments compared here | Vehicle wear from job-site duty cycles |
| Utility Fleets | Moderate — above general service fleets | Specialized equipment (aerial lifts, generators) |
| Government & Municipal Fleets | Varies widely by mission and vehicle mix | Procurement rules, extended hold periods |
| Heavy-Duty Trucking | Highest — $2.336/mile industry average (2025) | Mileage volume, equipment cost, compliance load |
Government and municipal fleets deserve a specific callout here, since their cost profile doesn't follow the same logic as a private commercial fleet: procurement rules often force longer hold periods and slower replacement cycles than a private fleet manager would choose voluntarily, which shifts the cost curve toward the maintenance-heavy end even when annual mileage stays modest.
Lease Versus Ownership: Financial Analysis
Choosing between leasing and owning commercial vehicles involves more than simple monthly-payment math — it shapes capital allocation, cash flow, and administrative burden for the length of the contract. Per Ryder's fleet total cost of ownership analysis, leasing delivers an average cost per mile of $0.65 compared to $0.80 for owned vehicles — a difference of up to 19% that compounds meaningfully across a multi-year holding period.
That gap challenges the common assumption that ownership automatically wins on cost, though the right answer still depends heavily on annual mileage, in-house maintenance capability, and how long the fleet actually intends to keep the asset. HDJ's truck leasing vs. purchasing TCO guide works through a full 5-year, 4-truck cost model if you want to run this comparison against your own fleet's numbers.
Administrative and Disposal Considerations
Leasing consolidates multiple expenses into a single monthly payment with simplified accounting. Ownership requires managing separate vendor relationships for maintenance, insurance, compliance tracking, registration renewals, and eventual disposal — administrative work that consumes management time better spent on core operations.
Resale complexity disappears entirely under a lease: vehicle owners face disposal timing decisions, condition assessments, and remarketing logistics that a lessor absorbs as part of the contract, and depreciation losses reaching 30–50% of original value hit owners directly in a way lease structures are specifically designed to avoid.
Leveraging Technology for TCO Optimization
Sophisticated analytical tools increasingly separate fleets with genuine cost control from fleets managing reactively off a spreadsheet. Fuel cards, maintenance systems, and telematics platforms already generate plenty of data for most fleets — the barrier isn't collecting it, it's that those systems don't connect.
A fuel card might flag a spending spike, but without maintenance and telematics data tied to the same vehicle, there's no way to tell whether the cause is an efficiency problem, an unauthorized purchase, or an inefficient route, and each of those has a different fix.
Integrated platforms that combine fuel, maintenance, and vehicle-performance data into one system give fleet managers a materially clearer picture of what's actually happening and why — but connected data alone doesn't guarantee better outcomes.
Vendor-sponsored fleet-technology research published in 2026 found that many fleets still review TCO quarterly or annually even after adopting more capable tools, meaning the technology's real advantage — catching problems as they develop instead of after a quarter has closed — goes largely unused unless the review cadence changes along with the software.
Telematics and Predictive Maintenance Systems
Telematics platforms enable the kind of proactive intervention that prevents cost creep before it compounds — connected sensors, cloud computing, and increasingly AI-driven analysis flag developing component issues well before they become roadside failures. Predictive maintenance programs commonly reduce unplanned failures by a substantial margin through early-warning detection, and fleet-wide fault-trend analysis is increasingly used to project remaining component life based on actual duty-cycle data rather than a fixed mileage interval alone.
Future-Proofing Fleet Operations
Forward-thinking fleet operations plan for technological shifts and regulatory change rather than reacting to them after the fact. Electrification adoption continues to vary significantly by vehicle class and application, and advanced TCO analysis for these technologies has to account for indirect impacts standard models miss — charging infrastructure investment, dwell time during charging, payload capacity trade-offs from added battery mass, and specialized maintenance requirements electric powertrains carry that diesel doesn't.
| Planning Factor | Reactive Approach | Forward-Looking Approach |
|---|---|---|
| Technology Adoption | Wait until forced by cost or mandate | Small pilot programs on suitable routes first |
| Regulatory Compliance | Last-minute adjustments near deadlines | Multi-year planning cycles tied to fleet renewal |
| Replacement Timing | Fixed calendar-based schedules | Data-driven, per-vehicle cost trend analysis |
| Resale Strategy | Sell only once a vehicle becomes a problem | Depreciation-curve analysis planned at acquisition |
None of the forward-looking column requires exotic tooling — it requires deciding, before the next acquisition cycle starts, which vehicles are candidates for a pilot, what the fleet's replacement triggers actually are in writing, and who owns the job of checking depreciation curves before a unit becomes a forced, urgent sale.
Optimizing Lifecycle and Replacement Timing
Strategic replacement timing balances escalating maintenance costs against declining residual value, and the optimal point arrives when a vehicle's annual operating cost exceeds the annualized TCO of a replacement unit. Key replacement indicators include maintenance costs climbing sharply relative to a vehicle's remaining value, downtime increasing beyond what the route can absorb, meaningfully declining fuel efficiency, and an approaching major-component replacement large enough to justify comparing against a new unit instead.
Frequently Asked Questions
What is the difference between fleet TCO and operating costs?
Fleet total cost of ownership covers every expense from acquisition through disposal — purchase price, financing, depreciation, and residual value included. Operating costs cover only the ongoing expenses like fuel, maintenance, insurance, and licensing. TCO gives the complete financial picture; operating costs capture day-to-day spend alone.
How often should fleets conduct comprehensive TCO analysis?
Leading fleets run monthly operational reviews for short-term trends, quarterly strategic assessments for major initiatives, and annual comprehensive analyses for budget planning. Even fleets with modern, connected data often default to quarterly or annual review cycles regardless — the technology supports continuous monitoring, but the habit of actually using it that way is what separates fleets that catch problems early from fleets that only find them after the quarter closes.
What costs do fleets typically fail to track accurately?
Downtime, administrative overhead, and accident-related costs are consistently the hardest for fleets to measure. Fleets can usually state a repair's exact cost but rarely know what it costs to have that same vehicle out of service — lost productivity, disrupted routes, and idle crew time that never appear on the repair invoice itself.
When should fleet vehicles be replaced based on TCO analysis?
Optimal replacement occurs when a vehicle's annual operating cost exceeds the annualized TCO of a replacement unit. Watch for maintenance costs climbing sharply relative to the vehicle's remaining value, downtime exceeding what the route can reasonably absorb, meaningfully declining fuel efficiency, and an approaching major-component failure large enough to justify a side-by-side comparison against new equipment rather than another repair.
How does leasing compare to ownership for fleet total cost of ownership?
Per Ryder's fleet total cost of ownership analysis, leasing averages $0.65 per mile versus $0.80 for owned vehicles — up to 19% in savings over time. Leasing offers predictable payments, transfers residual-value risk, and reduces administrative burden; ownership offers unlimited mileage and eventual equity in the asset. Each vehicle class and operating profile deserves its own analysis weighing annual mileage, in-house maintenance capability, cash flow needs, and how long the fleet actually intends to keep the unit.
Mastering fleet total cost of ownership starts with closing the connectivity gap, not collecting more data — the fleets getting this right are pulling fuel, maintenance, and telematics information into one view and reviewing it continuously rather than quarterly.
Whether the right structure is leasing or ownership for a given vehicle class, the fundamentals stay the same: track every cost category including the ones that don't generate a clean invoice, benchmark against the right peer segment, and replace equipment on the data rather than on the calendar.
Share This TCO Guide With Your Team
Pass this along to a colleague building next year's fleet budget — the hidden-cost categories here are usually the ones that blow past projections first.