
By Michael Nielsen, Publisher | 15+ Years in Diesel Repair
Last Updated: September 2026
⏱ Estimated reading time: 15+ minutes
Most equipment failures don't happen overnight. The warning signs show up weeks or even months before a breakdown occurs. Fleet oil analysis gives a manager the ability to spot these early indicators and take action before a minor issue becomes an expensive disaster.
Oil analysis transforms fleet management from reactive firefighting into strategic asset management. By tracking contamination level, wear metal, and fluid degradation, a fleet gains the data needed to make an informed decision about equipment health — maximizing uptime while controlling cost, two priorities that often seem at odds in daily operation. Michael Nielsen and Heavy Duty Journal's editorial team built this guide around what the technology actually measures, how to read a report correctly, and what a testing program genuinely costs versus what it can realistically save.
Not every testing program delivers equal value, though. The wrong sample location, an inconsistent procedure, or a misinterpreted result can lead to an unnecessary component replacement and a premature fluid change. Done correctly, laboratory testing becomes a genuine operational advantage.
Key Takeaways
- ✓Early detection prevents catastrophic failure: oil analysis identifies a wear pattern and contamination weeks before a breakdown occurs, allowing a planned repair instead of emergency roadside service.
- ✓The testing itself is cheap relative to what it prevents: a per-sample cost of $8–$20 is trivial against a single major engine failure running $20,000–$40,000 in direct repair.
- ✓Sampling technique matters: midstream sampling from warm, circulating oil produces an accurate result — a drain-plug sample contains settled debris that triggers a false alarm.
- ✓Trend data beats a single reading: a pattern across multiple samples reveals a developing problem more reliably than an isolated test result.
- ✓Regulatory compliance benefit: a documented oil analysis record demonstrates maintenance due diligence during a DOT audit and strengthens a warranty claim.
In This Guide
- Why Fleet Oil Analysis Matters for Operations
- Understanding Oil Analysis Fundamentals
- Critical Parameters Measured in Oil Analysis
- How to Read Oil Analysis Reports Effectively
- Warning Signs That Predict Equipment Failure
- Preventing Failures Through Data-Driven Decisions
- Implementing a Comprehensive Fleet Oil Analysis Program
- Cost-Benefit Analysis and Return on Investment
- Frequently Asked Questions
Why Fleet Oil Analysis Matters for Operations
Every breakdown carries a hidden cost that ripples through fleet operations in a way most managers never fully quantify. Regular oil sampling gives a fleet manager the intelligence needed to make an informed decision — rather than guessing when maintenance is necessary, the manager works with objective evidence that shifts the operation from schedule-based maintenance toward condition-based strategy.
The data reveals a problem developing inside an engine long before it escalates into a catastrophic failure. This visibility enables a targeted intervention that maximizes equipment life while minimizing an unnecessary service event.
The Financial Impact of Equipment Failures
A single engine failure costs roughly $20,000 to $40,000 in direct repair expense, and that figure represents only the beginning of the financial damage — the indirect cost often exceeds the repair bill itself.
$448–$760/day
Average cost of unscheduled commercial truck downtime, per vehicle, as of 2026 — Element Fleet Management.
An emergency repair compounds this loss significantly. When a breakdown happens on the road, a fleet faces a towing charge, a rush shipping fee for a replacement part, a premium labor rate for an emergency service call, a hotel cost for a stranded driver, and expedited freight to fulfill a customer commitment — and a contract penalty adds another layer, since many fleet agreements include a service-level commitment with a monetary penalty for a missed delivery window.
Cutting Costs Through Strategic Monitoring
Predictive maintenance flips the economics of fleet operations. Instead of changing oil based on an arbitrary mileage interval, a fleet can extend a drain period safely based on actual oil condition — many operations move from roughly 25,000-mile intervals toward 40,000–50,000 miles once trend data supports it, delivering a direct reduction in material cost, disposal expense, and labor hours per vehicle over the life of the fleet. HDJ's diesel engine maintenance schedule guide covers how an oil-analysis-informed interval fits into the rest of the PM calendar.
Early detection prevents a small issue from becoming a major repair. When oil analysis reveals an elevated iron level indicating bearing wear, replacing the bearing runs a few thousand dollars. Ignoring the warning and letting the bearing fail in service typically means a full engine teardown at several times that cost.
Meeting Regulatory Requirements
Maintenance compliance creates a documented shield against regulatory scrutiny and legal exposure. Federal and state transportation agencies require proof of proper vehicle maintenance under 49 CFR Part 396. An oil analysis report provides objective, third-party documentation that withstands inspection.
During a DOT audit, a comprehensive oil analysis record demonstrates due diligence — an inspector sees evidence of systematic monitoring rather than reactive repair. HDJ's DOT inspection checklist guide covers the broader documentation an inspector actually checks. A warranty claim benefits too: when a component fails under warranty, a manufacturer often disputes coverage by claiming improper maintenance, and an oil analysis report provides evidence of proper lubrication and care.
Understanding Oil Analysis Fundamentals
Modern laboratory testing transforms a simple oil sample into a comprehensive diagnostic report that reveals what's happening inside an engine. A fleet manager who understands the fundamentals gains the ability to spot a problem weeks or months before it causes a breakdown.
What Happens During Laboratory Testing
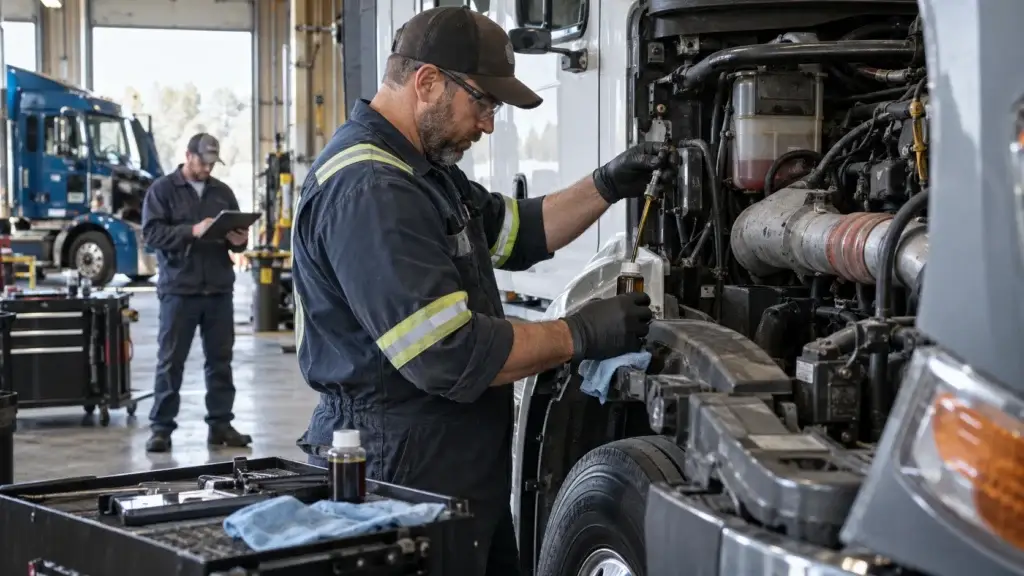
Once an oil sample arrives at the laboratory, a technician follows a standardized workflow designed to extract maximum information from each specimen, starting with sample registration and barcode assignment to maintain traceability throughout testing.
Spectrometric analysis represents the first major testing phase. An instrument heats the oil sample to an extremely high temperature, causing an element to emit a distinctive wavelength of light — this signature identifies and quantifies metal down to parts per million, revealing a wear pattern from a specific engine component.
Viscosity measurement follows a precise protocol using a calibrated instrument at a standardized temperature, assessing how easily the oil flows at 40°C and 100°C to detect whether the lubricant maintains proper thickness or has degraded beyond an acceptable limit. Infrared spectroscopy examines the oil's molecular structure to detect contamination and degradation — identifying an oxidation level, nitration from a combustion byproduct, fuel dilution, and the remaining additive package that protects against wear and corrosion.
Recommended Sampling Frequency by Vehicle Type
Establishing an appropriate sampling frequency balances the cost of testing against the risk of an undetected problem. A different vehicle classification and operating condition demands a varied monitoring interval.
| Vehicle Classification | Operating Conditions | Sampling Frequency | Primary Concerns |
|---|---|---|---|
| Over-the-Road Tractors | Highway, Normal Service | 25,000–30,000 miles | Gradual wear, fuel dilution |
| Vocational Trucks | Mixed, Severe Service | 15,000–20,000 miles | Contamination, accelerated wear |
| Light-Duty Fleet Vehicles | Urban, Variable | Per OEM oil change interval | Fuel dilution, moisture |
| Severe Service Equipment | Extreme temp, dusty, high idle | 10,000–15,000 miles or 250–300 hours | Dirt ingestion, oxidation |
New equipment benefits from early sampling to establish a baseline value — taking a sample at 5,000 miles creates reference data for future comparison that helps identify an abnormal pattern before it causes damage.
Proper Sample Collection Techniques
Sample quality determines result reliability more than any other factor in oil analysis. A contaminated or unrepresentative sample generates misleading data that can lead to a poor maintenance decision.
One of the most common mistakes a fleet makes is sampling from the drain plug during a regular oil change. That oil is loaded with settled debris that doesn't represent what's actually circulating through the engine — this produces an artificially high wear-metal concentration that triggers an unnecessary alarm.
The best practice is midstream sampling while the engine operates at normal temperature, capturing oil as it circulates through the system rather than settled contamination. A dedicated sampling valve installed on the oil pan or filter housing eliminates a variable and improves consistency. Sample collection should occur when oil temperature reaches at least 160°F — warm oil contains a suspended particle and contaminant that settles when cold, so this temperature requirement ensures the sample includes everything actually circulating during operation.
Critical Parameters Measured in Oil Analysis
Every oil sample provides measurable evidence of what's happening inside a fleet's engines. Laboratory testing examines dozens of distinct parameters that reveal equipment condition with real precision, falling into three essential categories a fleet manager should understand.
Wear Metals and Component Degradation
A metal appearing in an oil sample serves as direct evidence of mechanical wear occurring inside a sealed engine system. A different metal identifies a different failing component, giving a fleet manager the power to diagnose a problem before a complete failure occurs.
Iron is the most common wear metal found in engine oil analysis, primarily originating from the cylinder liner where a piston travels thousands of times per minute, with additional sources including the crankshaft, camshaft, and valve train. A normal range for a diesel engine runs roughly 20 to 50 parts per million — real-world lab averages across a broad diesel sample set run closer to the upper end of that range, so a fleet's own baseline matters more than any single published number.
A reading exceeding 100 ppm, or one that doubles within a single sampling interval, signals significant wear threatening engine reliability. Steel components contain both iron and chromium — elevated chromium alongside iron often indicates piston ring wear.
Copper and lead measurement provides critical insight into bearing condition. These soft metals form the overlay and babbitt layer that protects a bearing surface — simultaneous elevation of both metals provides strong evidence of bearing distress requiring immediate attention.
Contamination Detection
An external contaminant entering engine oil compromises lubrication effectiveness and accelerates component wear. These intrusions originate from a failed seal, a damaged filtration system, or a cooling system breach.
Silicon appears when dust enters through a compromised air filtration system or a damaged seal — this abrasive contamination accelerates wear across every engine surface. A clean engine typically shows silicon below 15 ppm, while a reading above 30 ppm confirms a filtration problem allowing dirt ingestion.
Coolant should never mix with engine oil. Laboratory detection of glycol, sodium, or potassium definitively indicates a cooling system breach — a common failure point includes an EGR cooler, a head gasket, and an oil cooler seal. Even trace coolant contamination forms a corrosive acid and sludge that rapidly destroys a bearing surface.
Fuel dilution occurs when unburned diesel or gasoline contaminates engine oil, reducing viscosity and load-carrying capacity while accelerating oxidation. A common cause includes a leaking injector, excessive idling, and incomplete combustion — dilution above 2% thins the protective oil film, and at 5% dilution, lubrication effectiveness becomes severely compromised.
Oil Condition Assessment
The lubricant itself requires evaluation beyond simply checking for contamination. Oil degrades through thermal stress, chemical oxidation, and additive depletion — changes that compromise protective capability even when contamination remains absent.
Viscosity is the single most critical oil property affecting equipment protection. A viscosity loss indicates fuel dilution or shear breakdown of a viscosity modifier additive; a viscosity increase suggests oxidation, soot loading, or coolant contamination. Total Base Number (TBN) measures the oil's remaining alkalinity reserve for neutralizing a combustion acid — a declining TBN indicates additive depletion that leaves an engine vulnerable to corrosive wear, and once TBN depletes below roughly half the new-oil value, protection diminishes rapidly.
| Parameter Category | Key Indicators | Normal Range | Critical Threshold |
|---|---|---|---|
| Wear Metals | Iron, Copper, Lead | Iron: 20–50 ppm; Copper/Lead: <30 ppm | Iron: >100 ppm; Copper: >50 ppm |
| Contaminants | Silicon, Sodium, Fuel % | Silicon: <15 ppm; Sodium: <10 ppm; Fuel: <2% | Silicon: >30 ppm; Sodium: >20 ppm; Fuel: >5% |
| Oil Condition | Viscosity, TBN, Oxidation | Viscosity: ±10% grade; TBN: >50% new | Viscosity: >15% change; TBN: <3; Oxidation: >25 units |
| Critical Elements | Aluminum, Chromium | Aluminum: <15 ppm; Chromium: <10 ppm | Aluminum: >30 ppm; Chromium: >20 ppm |
These ranges are commonly cited starting points, not a universal standard — engine design, oil formulation, and duty cycle all shift what "normal" looks like for a specific fleet, which is exactly why a trend against the fleet's own baseline outperforms comparing a single reading to a generic chart.
How to Read Oil Analysis Reports Effectively
Every oil analysis report contains critical information that reveals equipment's true condition, if a manager knows where to look. A fleet manager who understands how to extract meaningful insight from these numbers gains an advantage through earlier problem detection and a smarter maintenance decision.
A single oil sample provides just a snapshot of engine health at one moment in time. The real value emerges when results get tracked over multiple service intervals — unless the data shows a catastrophic failure in progress, an isolated reading rarely justifies a major maintenance action.
Decoding Report Formats
Most laboratories organize information into distinct sections that each serve a specific diagnostic purpose. The physical properties section typically appears first, covering viscosity measurement and oil appearance. The elemental analysis section presents wear metal and contaminant in parts per million, revealing which internal component is wearing and whether an external contaminant has entered the system. The fluid properties section evaluates oil condition through a measurement like TBN, oxidation level, and nitration — showing chemical breakdown from heat and combustion byproduct.
Understanding Severity Codes
A laboratory uses a color-coding and flagging system to highlight an abnormal result requiring attention. Most systems use a three-tier classification: normal status for a value within an expected range, a caution flag for an elevated reading that isn't yet critical, and a critical alert signaling immediate action to prevent imminent failure.
The challenge with a severity code lies in its generic nature. A laboratory establishes a threshold based on a broad industry average, which may not perfectly match a specific fleet's operating condition — a caution flag for iron content might be normal for equipment in severe-duty cycles, while a seemingly normal reading could be abnormal for a light-duty application.
Trending Data Across Multiple Intervals
The fundamental principle of effective trend analysis is that a pattern reveals more than an absolute value. A single elevated reading might result from a contaminated sample collection, a laboratory variation, or a temporary operating condition — a consistent trend across multiple samples indicates a real change in equipment condition.
Plotting a key parameter over time transforms a raw number into a visual pattern that highlights a developing problem. A gradual increase in iron concentration might indicate normal wear progression as a component ages; a sudden spike signals a component failure event requiring immediate investigation. Many fleet management software platforms automatically graph a trend when results from successive samples get entered — a simple spreadsheet chart accomplishes the same thing for a fleet that lacks that capability.
Warning Signs That Predict Equipment Failure
Certain patterns in oil analysis data serve as an early warning signal that equipment is transitioning from normal wear to imminent failure. A fleet manager who develops pattern-recognition skill can identify these signs before a minor issue escalates into an expensive repair.
Rapidly Increasing Wear Metal Concentrations
A gradual increase in wear metal over time is expected as a component experiences normal friction during operation. A sudden spike, though, signals excessive friction, misalignment, or early-stage mechanical failure — when a wear metal trend shows doubling between consecutive samples, investigation should happen before a minor issue leads to unexpected downtime.
The critical distinction lies between a linear and an exponential progression. Normal wear produces a relatively steady increase that plots as a straight line on a trend chart. Accelerated degradation appears as a sharp upward curve or a sudden step-change indicating a component has transitioned from controlled wear to a destructive failure mode.
Sudden Viscosity Changes
A viscosity loss of more than 10–15% from baseline suggests significant fuel dilution requiring a fuel system inspection. A viscosity increase of similar magnitude indicates oxidation, soot loading, or coolant contamination, necessitating an immediate oil change and a root-cause investigation. A high oxidation level usually points to excessive heat or oil staying in service too long — this breakdown process leads to sludge formation, increased viscosity, and poor engine efficiency, with the resulting deposit restricting an oil passage and starving a component of adequate lubrication.
Contamination Patterns
Understanding a contamination pattern helps a fleet manager distinguish between a one-time event and a systemic problem indicating an equipment defect. Even a small coolant leak is a serious problem, since coolant contamination breaks down oil's lubricating properties, leading to bearing failure, internal corrosion, and sludge buildup.
Isolated coolant detection might result from recent repair work or temporary gasket seepage. Consistent coolant presence across multiple samples, though, proves an ongoing breach requiring component replacement. Fuel dilution appearing seasonally correlates with cold-weather starting and idling practice — this pattern represents an operational condition rather than a mechanical defect.
Abnormal Additive Depletion Rates
TBN dropping faster than the historical rate represents an often-overlooked warning sign. Accelerated depletion may indicate a more severe operating condition, contamination with an acidic material, or counterfeit oil lacking an adequate additive package. A common cause includes extended idling generating combustion acid without sufficient operating temperature, a biodiesel blend accelerating oxidation, coolant contamination introducing glycol that consumes an alkaline additive, and the wrong-specification oil providing insufficient protection for the operating condition.
Preventing Failures Through Data-Driven Decisions
Data-driven maintenance decisions transform oil analysis from diagnostic information into catastrophic failure prevention. The most successful fleet operations establish a systematic framework that converts a laboratory finding into a specific maintenance intervention.
Establishing Equipment-Specific Decision Points
A generic laboratory alert level provides a starting point, but a sophisticated fleet program develops a customized action threshold for each vehicle class. A heavy-duty long-haul tractor needs a different limit than a medium-duty delivery truck — equipment age, accumulated operating hours, and duty-cycle severity all influence the appropriate threshold value.
Historical failure pattern within a specific equipment family guides threshold development. A fleet operating a given engine platform, for example, might set a tighter copper threshold for a platform known to be sensitive to bearing wear than for one that historically runs cleaner — the point is that the generic chart is a starting point, not a substitute for a fleet's own accumulated experience with its specific equipment.
Free Diesel Maintenance Checklist
Get HDJ's free, field-tested diesel maintenance checklist delivered instantly to your inbox — print it, laminate it, keep it in the shop.
Instant PDF • 100% Free • No Spam
Building Response Protocols
A threshold exceedance requires a predetermined response protocol that eliminates decision paralysis. A fleet manager implements a decision tree specifying an action for a minor, moderate, and critical finding.
A minor threshold violation typically triggers increased monitoring frequency — a wear metal concentration 10% above normal warrants retesting at half the standard interval. A moderate exceedance warrants a scheduled repair at the next convenient service interval. A critical finding demands immediate unit removal from service — coolant contamination exceeding 0.5% indicates a seal failure requiring emergency attention.
Implementing a Comprehensive Fleet Oil Analysis Program
Implementing an effective oil analysis program involves coordinating multiple elements including a laboratory partnership, personnel training, and a data management system. Success requires more than understanding a test result — a fleet manager must establish an operational framework that integrates analytical data into a daily maintenance decision.
Choosing an Analytical Partner
Laboratory selection determines the quality and usefulness of every analysis result a fleet receives — not every testing facility has equal expertise in commercial vehicle application, and choosing a partner with specialized heavy-duty diesel experience ensures an accurate interpretation specific to the fleet's actual equipment.
Evaluate a potential partner beyond basic pricing. Turnaround time commitment affects how quickly a fleet can respond to a critical finding. Report quality separates an exceptional laboratory from an adequate one — the best analytical partner provides a clear, actionable recommendation rather than a raw data dump requiring expert interpretation. Accreditation and quality-control procedure ensure analytical accuracy and repeatability — an ISO 17025 certification demonstrates commitment to a standardized testing protocol.
Developing Proper Sampling Skills
Technician training establishes the foundation for a reliable analytical result throughout a fleet. Even a perfect laboratory analysis produces a misleading conclusion if sampling introduces contamination or captures an unrepresentative oil condition.
Initial training should cover proper sampling equipment selection and maintenance, identification of the correct sampling location for a different vehicle model, a timing requirement ensuring a sample represents a normal operating condition, a contamination-prevention technique, and a documentation requirement.
Creating Documentation Infrastructure
Establishing a documentation and tracking system provides the organizational framework that makes program implementation sustainable — without a proper record, even an excellent analytical result fails to deliver maximum value.
A unit identification system ensures a sample associates correctly with a specific vehicle. Interval tracking schedules sampling at an appropriate frequency without relying on technician memory, and a historical database enables trend analysis across multiple sampling events that reveals a pattern invisible in a single test result. Integrating a result into fleet management software eliminates a manual process and saves administrative time while ensuring accuracy.
Cost-Benefit Analysis and Return on Investment
Understanding the complete financial picture of oil analysis requires examining not just the testing cost, but the comprehensive economic impact spanning direct saving, avoided expense, and preserved revenue.
Testing Costs Versus Repair Expenses
Oil analysis represents an added expense running roughly $8 to $20 per test depending on panel comprehensiveness, as of September 2026. This marginal cost is small against a seized engine and its associated downtime — a single major engine failure costs $20,000–$40,000 in direct repair expense, not including emergency logistics and a customer service failure.
The arithmetic is straightforward: testing 50 vehicles twelve times annually at $15 per sample totals $9,000. Preventing a single major failure, at $20,000–$40,000, more than covers a full year of testing for the whole fleet — the math holds even before counting a smaller prevented repair, an extended drain interval, or a reduced downtime day.
Treat any vendor's own published ROI percentage with the same skepticism as any other sales material, and build the specific case from the fleet's own before-and-after data rather than a marketing number — the oil-analysis industry, like the fleet-software industry, publishes a wide range of self-reported ROI figures that don't reconcile with each other from vendor to vendor.
Extending Oil Drain Intervals
Condition-based oil-change scheduling delivers a real maintenance saving by eliminating an unnecessary service event. Extending a service interval from a conservative 25,000-mile standard toward 40,000–50,000 miles, based on actual oil condition rather than a fixed schedule, reduces material cost, labor hour, and disposal expense proportionally to the reduced number of changes. Fleets must comply with EPA used oil management standards for proper handling and disposal regardless of interval length.
Quantifying Downtime Reductions
The economic impact of an unplanned service interruption often dominates a program's overall return. A fleet that catches a developing problem during scheduled maintenance, rather than at roadside, converts an emergency repair plus lost revenue into a planned service event — at $448–$760 per day in lost operating value per the figure cited earlier, even a modest reduction in unplanned downtime days across a fleet adds up quickly.
The specific return for any given fleet depends on its own baseline downtime and failure rate, which is exactly the data a testing program starts generating from month one.
Frequently Asked Questions
How often should fleet vehicles have oil analysis performed?
It depends on vehicle type and operating condition. An over-the-road tractor typically benefits from sampling every 25,000–30,000 miles, while a vocational truck in severe service should be tested every 15,000–20,000 miles. Equipment in extreme temperature, a dusty environment, or with extended idling may need sampling every 10,000–15,000 miles or 250–300 hours. New or rebuilt equipment should have a baseline sample taken at 5,000 miles.
What is the most common mistake fleets make with oil sampling?
Collecting a sample from the drain plug during an oil change. Oil at the drain point contains settled debris and concentrated contaminant that doesn't represent what's actually circulating during operation, producing an artificially elevated wear-metal reading that triggers a false alarm. Proper technique requires midstream sampling from warm, circulating oil at operating temperature (minimum 160°F) using a dedicated sampling valve or port.
How much does a fleet oil analysis program cost?
Testing runs $8 to $20 per sample depending on panel comprehensiveness. For a 50-vehicle fleet tested monthly, annual laboratory expense totals roughly $9,000 — a figure that a single prevented major engine failure ($20,000–$40,000) comfortably covers for a year or more.
What wear metal levels should trigger immediate action?
A common guideline flags iron exceeding 100 ppm, copper above 50 ppm, and aluminum greater than 30 ppm, though the exact threshold varies by engine platform. Absolute value matters less than trend, though — a parameter that doubles between consecutive samples warrants investigation regardless of whether it exceeds a generic threshold. Coolant contamination at any detectable level, and fuel dilution above 5%, require immediate attention.
Can oil analysis help extend drain intervals?
Yes — this is one of the most valuable applications. When testing confirms oil condition remains within an acceptable parameter, a fleet can safely extend a drain interval from a manufacturer-recommended 25,000-mile standard toward 40,000–50,000 miles, reducing material cost, labor hour, and disposal expense. Extending a drain still requires consistent monitoring, since each sample verifies the oil still provides adequate protection.
How do oil analysis results affect DOT compliance?
An oil analysis record serves as documented evidence of systematic preventive maintenance during a CVSA inspection and DOT audit. While not explicitly required by 49 CFR 396.3 recordkeeping, a comprehensive testing record demonstrates due diligence that exceeds a minimum standard and proves valuable during a liability claim or warranty dispute.
Making Fleet Oil Analysis Work for Your Operation
Fleet oil analysis extends far beyond simple cost saving. This technology provides a fleet manager with visibility into a sealed mechanical system that was impossible just decades ago. A program built on a fixed maintenance interval wastes resource by servicing equipment that doesn't need attention while missing a problem developing between scheduled service.
A forward-thinking operation recognizes that a data-driven decision identifies an actual need — the difference between reacting to a breakdown and preventing it defines operational excellence. The question isn't whether a fleet can afford to implement comprehensive testing; it's whether the fleet can afford not to, the same discipline Michael Nielsen and Heavy Duty Journal's editorial team hold every guide on heavydutyjournal.com to.
Share This Guide With Your Team
If this guide helped clarify the value of oil analysis for your fleet, share it with a colleague who could benefit from implementing these practices.