
By Michael Nielsen, Publisher | 15+ Years in Diesel Repair
Last Updated: September 2026
⏱ Estimated reading time: 15+ minutes
A transmission rebuild on a Class 8 truck doesn't happen without warning — it happens without noticed warning. The sign is almost always there in the fluid weeks or months before a gear fails or a bearing seizes: an elevated wear metal climbing sample over sample, a viscosity drifting out of specification, a particle count trending upward. The problem is that most fleets either aren't pulling a sample at all, or they're pulling one without a systematic program to catch what the data is actually saying.
Michael Nielsen and Heavy Duty Journal's editorial team built this guide to cover what transmission fluid analysis measures, how to read the results, what a wear metal is telling you about component health, and how to build a program that turns fluid data into an actual maintenance decision.
Transmission fluid analysis for fleet operations is one of the most cost-effective predictive maintenance tools available to a fleet manager and technician — unlike engine oil analysis, which gets most of the attention in a used-oil program, transmission fluid analysis is underutilized despite the fact that an automatic and automated manual transmission represents some of the highest-cost components on a commercial vehicle.
Key Takeaways
- ✓Trend data beats a single-sample reading: no individual fluid analysis result is definitive. A wear metal level means little without a baseline trend from the same unit, and an accelerating trend is the real alert signal.
- ✓Transmission fluid analysis differs from engine oil analysis: the test parameters, wear metal sources, condemning limits, and interpretation logic are distinct — what reads as alarming in an engine context can be normal for a transmission fluid, and vice versa.
- ✓Sampling technique determines data quality: an incorrect sample collection — the wrong draw point, contaminated tubing, stagnant fluid — can produce a misleading result that triggers an unnecessary service or misses a real problem.
- ✓Program consistency is the difference between useful data and wasted lab fees: sampling at a consistent interval, on the same unit, with complete documentation creates the trending history that makes a predictive decision possible.
- ✓Fluid analysis enables drain interval optimization: a data-driven extended drain decision on a synthetic transmission fluid can reduce a fluid cost and service labor while maintaining protection — but only when the analysis confirms it's safe to extend.
In This Guide
- What Is Transmission Fluid Analysis?
- The Tests Inside a Transmission Fluid Analysis Report
- Reading Wear Metal Results in Heavy-Duty Transmissions
- Contamination Indicators: What the Lab Is Actually Telling You
- Why Trending Matters More Than Any Single Sample
- Understanding Fluid Condition Beyond Wear Metals
- Sampling Technique: Where Most Fleet Programs Break Down
- Building a Fleet-Wide Transmission Fluid Analysis Program
- Frequently Asked Questions
What Is Transmission Fluid Analysis?
Transmission fluid analysis is a laboratory process in which a sample of used automatic transmission fluid (ATF) or gear oil drawn from an in-service transmission is tested for a wear metal, a contaminant, a fluid condition indicator, and an additive depletion. The results are interpreted — ideally in the context of a previous sample from the same unit — to assess the mechanical health of the transmission, the remaining service life of the fluid, and whether any condition warrants further inspection or immediate corrective action.
The concept follows the same logic as a used engine oil analysis, which most maintenance professionals are more familiar with: a lubricating fluid circulates through a mechanical system and picks up a trace of whatever it contacts. A wear debris from a gear, a bearing, a clutch pack, and a bushing becomes suspended in the fluid. A contaminant that enters from outside — dirt, water, coolant — leaves a detectable signature. The fluid's own chemistry changes as an additive depletes and oxidation advances.
What makes transmission fluid analysis distinct from engine oil analysis is the mechanical complexity of the system being monitored and the different baseline expectation for a normal wear metal. A heavy-duty automatic transmission contains a clutch pack, a planetary gear set, a torque converter component, a hydraulic pump, a bearing, a bushing, and a fluid cooler — all made from a different material that produces a different wear signature.
Understanding what normal looks like in a given transmission type is essential for interpreting a result correctly, which is why a fleet program benefits substantially from a laboratory with specific experience in heavy-duty transmission fluid.
The Tests Inside a Transmission Fluid Analysis Report
A standard transmission fluid analysis report from a commercial laboratory covers several categories of measurement. The specific tests included depend on the package selected, but a comprehensive program for a heavy-duty fleet application should include every one of the following.
Elemental Spectroscopy (ICP-OES)
Inductively coupled plasma optical emission spectrometry (ICP-OES) is the foundation of most fluid analysis programs. It measures the concentration of up to 21 or more chemical elements in the oil sample, expressed in parts per million (ppm). These elements fall into three groups: a wear metal generated by component contact (iron, copper, aluminum, tin, lead, chromium, nickel, silver), an additive metal that's part of the fluid's chemical package (calcium, magnesium, zinc, phosphorus, boron), and a contaminant indicator (silicon for dirt, sodium and potassium for coolant entry).
An important technical limitation of ICP-OES is particle size: the method detects a particle up to approximately 8 to 10 microns in diameter. A fine particle generated during normal wear is captured reliably. A larger particle — which indicates more aggressive, potentially catastrophic wear — may be present in the fluid without registering on an elemental analysis, which is why spectroscopy alone is insufficient for a high-criticality transmission.
As detailed in research on wear limits versus trends from Machinery Lubrication, interpreting a spectrometric reading requires understanding the source of each element, not just its absolute concentration.
Viscosity Testing
Viscosity — a fluid's resistance to flow — is among the most important single measurements in a transmission fluid analysis report. An automatic transmission fluid is formulated to a precise viscosity specification because the hydraulic control system in an automatic and automated manual transmission depends on a consistent fluid pressure to shift correctly and engage a clutch pack with proper force. Viscosity is measured at standard temperatures, typically 40°C and 100°C, and compared against the specification for the fluid type in use.
A low viscosity reading indicates a possible solvent contamination, a fluid overheating that has broken down the base oil, or a fuel dilution — rare in a transmission but possible in a system with a fuel-powered accessory sharing a fluid system. A high viscosity indicates an oxidation or the presence of an insoluble material, such as a soot contamination from a cooler system failure. Either direction signals a fluid that's no longer providing the hydraulic and lubricating performance the transmission requires.
Particle Count and Ferrous Wear Concentration
A particle count measures the total number of particles present in the fluid sample above a specific size threshold and is reported using the ISO 4406 cleanliness code. Unlike an elemental spectroscopy, a particle counting isn't limited by particle size in the same way — it captures larger debris that ICP-OES misses.
An ISO 4406 cleanliness code uses a three-number system (for example, 18/16/13) representing a particle count at a 4-micron, 6-micron, and 14-micron threshold. An increasing ISO code over successive samples indicates a degrading fluid cleanliness and often precedes a detectable mechanical failure.
A ferrous wear concentration, also called a PQ Index or ferrous debris analysis, specifically measures the mass of a ferromagnetic particle in the sample, with no particle size upper limit. When a ferrous wear concentration rises dramatically while an iron ppm from spectroscopy remains stable or declines, it signals that a large iron-containing particle is being generated — a pattern consistent with accelerating mechanical damage.
Contamination Screening
Most transmission fluid analysis packages include screening for a water content, a coolant presence (glycol detection), and an insoluble content. Water in transmission fluid accelerates oxidation, promotes corrosion of a metal component, and degrades the fluid's lubricating film.
Coolant entry — typically from a failed transmission fluid cooler — is a serious contamination event that raises a sodium, potassium, or both, and can cause catastrophic internal damage if left unaddressed. A silicon level above the baseline established for the specific fluid type indicates a dirt ingestion through a seal failure or from improper fluid handling during service.
Reading Wear Metal Results in Heavy-Duty Transmissions
Interpreting a wear metal reading in transmission fluid analysis isn't as straightforward as looking at an absolute ppm value against a universal threshold table. The normal range for each element depends on the transmission model, the type of fluid in use, the mileage or hours on the sample, and the baseline established from a previous sample on the same unit. With that context established, the following table covers the primary wear metal found in a heavy-duty transmission fluid and what each indicates.
| Wear Metal | Source Components | Elevated Reading May Indicate |
|---|---|---|
| Iron (Fe) | Gears, shafts, bearings, clutch plates, housing | Gear or bearing wear; accelerating trend warrants investigation |
| Copper (Cu) | Bronze bushings, oil cooler, clutch packs (varies by OEM) | Bushing wear or cooler degradation; normal range varies significantly by transmission |
| Aluminum (Al) | Housing, oil pump components, bearing cages, gear pump vanes | Pump wear or housing damage; dirt entry when elevated with silicon |
| Tin (Sn) | Bearing cages, bronze bushings, alloy components | Bushing wear; elevated together with copper and lead often indicates bronze bushing failure |
| Lead (Pb) | Bearing alloys, bronze bushing alloy | Bearing degradation when trending upward with other bushing metals |
| Silicon (Si) | External dirt, sealants, antifreeze additives | Dirt contamination from seal failure or improper fluid handling; elevated with aluminum suggests abrasive ingestion |
| Sodium / Potassium (Na/K) | Coolant (antifreeze) | Coolant entry — typically cooler failure; requires immediate attention |
| Chromium (Cr) | Ball and roller bearings, alloy in gear steel | Anti-friction bearing wear; trending increase warrants inspection |
A real, unplanned Class 8 transmission failure is a genuinely expensive event once you account for the full picture. Independent 2026 shop pricing places a manual or AMT rebuild in the roughly $3,500 to $8,500 range depending on transmission type and internal damage, while a full installed replacement runs $8,000 to $15,000 — and that's before towing, downtime, and lost revenue enter the calculation. Against that, a $20-$75 fluid sample is a small price for the early warning that keeps a repair scheduled and controlled instead of a roadside emergency.
Contamination Indicators: What the Lab Is Actually Telling You
A wear metal gets most of the attention in a transmission fluid analysis report, but a contamination reading often carries the most urgent operational implication. A wear metal trend developing over multiple samples gives you time to plan. A contamination indicator can signal a problem that requires action before the next scheduled service interval.
Coolant contamination is the most critical finding in any transmission fluid analysis. When a sodium or potassium reading rises above baseline — particularly if both rise together — it indicates a glycol-based antifreeze is entering the fluid circuit. In a heavy-duty truck, the most common pathway is a failed transmission fluid-to-coolant heat exchanger.
Coolant in ATF disrupts the fluid's lubricating film, causes an internal corrosion, and can lead to a varnish buildup that restricts a hydraulic passage. A single lab report showing elevated sodium or potassium should trigger immediate inspection of the cooler circuit, not a watch-and-see approach at the next sampling interval.
Silicon contamination tells a different story depending on its level and trajectory. Some silicon is normal in most transmission fluids, contributed by a silicone-based antifoam additive in the fluid chemistry itself and from an assembly compound used during manufacturing. A baseline silicon for a given fluid type establishes the reference point. A sudden increase above that baseline, particularly when accompanied by elevated aluminum, indicates an abrasive dirt ingestion — typically through a degraded seal or breather cap — which causes an accelerated abrasive wear across every internal surface.
Water contamination without a coolant marker usually indicates a condensation accumulation, common in an application with significant temperature cycling — a seasonal operation, an urban stop-and-go route with a frequent cold start, or an equipment that sits for an extended period. While lower-severity than coolant entry, water in transmission fluid still accelerates oxidation and promotes corrosion of a ferrous and non-ferrous component.
⚠️ Safety Warning
Transmission fluid operates at high temperatures — a service temperature in a loaded Class 8 automatic can exceed 200°F (93°C). Always allow the vehicle to cool and verify fluid temperature before opening a drain plug or drawing a live sample. Use appropriate PPE — a heat-resistant glove, eye protection — when working with hot transmission fluid or sample collection equipment on a warm component.
One of the most common misinterpretation errors in a fleet transmission fluid program involves a copper reading. Because copper can originate from multiple sources — a bronze bushing, a cooler core, a clutch pack material — and because some transmission designs use a sintered copper-alloy clutch pack as a standard design feature, a copper reading that appears alarming can be entirely within a normal operating parameter for that specific unit.
This is precisely why a laboratory experience with heavy-duty transmission fluid and access to OEM baseline data matters more than the absolute ppm value.
Why Trending Matters More Than Any Single Sample
This point cannot be overstated: a single transmission fluid analysis sample, read in isolation, provides limited diagnostic value. The real power of transmission fluid analysis as a predictive maintenance tool emerges from the trend line created by a consistent, recurring sample on the same unit over time. This is the fundamental difference between using fluid analysis as a compliance exercise and using it as a genuine predictive maintenance tool.
Consider an iron reading as an example. A transmission fluid sample showing 45 ppm iron may be alarming in a unit that has consistently shown 12 to 18 ppm iron across five previous samples. The same 45 ppm reading in a unit with a baseline that runs 38 to 52 ppm is unremarkable. Without the trend history, both readings look identical in a report. With the trend history, the first is a red flag and the second is business as usual.
Cummins has noted in its technical guidance for a used oil analysis program that an oil sample collection interval must be structured to enable a trend comparison, and that background data covering an engine model, hours on oil, and maintenance history is required for an analysis to be used correctly. The same principle applies directly to a transmission fluid program: a consistent interval, a complete unit documentation, and a systematic data retention are what transform an individual lab report into an actionable fleet maintenance intelligence system.
Practically, this means that starting a fluid analysis program requires building a baseline before you can make a meaningful predictive judgment. Pull an initial sample on each transmission in the target fleet. Pull a second sample at your chosen interval — typically the next scheduled service event, or at a defined mileage or hour threshold.
By the third sample, you have the beginning of a trend line. By the fifth or sixth sample, you have a reliable pattern and can begin using a deviation from that pattern as an early warning signal for a developing problem.
Most a commercial laboratory that serves a fleet maintenance program provides trend charting as part of its reporting. The report for each sample will typically show the current result alongside a prior result from the same unit, often in graphical form. If your laboratory program doesn't provide this automatically, maintain your own trending spreadsheet organized by unit number, sample date, and mileage.
The TMC (Technology & Maintenance Council) Recommended Practices library covers a lubrication management standard for a heavy-duty fleet and provides guidance on establishing a systematic maintenance documentation practice that supports a fluid analysis program.
Understanding Fluid Condition Beyond Wear Metals
A comprehensive transmission fluid analysis report includes a fluid condition test that provides insight into the health of the fluid itself, independent of what it has picked up from mechanical wear. These tests matter because a fluid can show an acceptable wear metal level while simultaneously being chemically degraded to the point where it's no longer providing the protection the transmission requires.
Viscosity, as discussed earlier, is the most important single fluid condition indicator. ASTM D445, the standard test method for kinematic viscosity of a transparent and opaque liquid, is the measurement procedure used by most commercial laboratories. The ASTM D445 standard establishes the methodological basis for a viscosity measurement that enables a meaningful comparison across samples and between laboratories.
Viscosity results should be compared to the OEM-specified range for the fluid type in use, not a generic "ATF viscosity" expectation, because a modern heavy-duty transmission fluid spans a significant range of viscosity grades depending on its application.
Total acid number (TAN) measures the acidic component in the fluid, which accumulates as the fluid oxidizes and an additive package depletes. A rising TAN reading over successive samples indicates an advancing fluid degradation — the fluid is becoming more corrosive to the internal metal surface it's designed to protect. A TAN trending upward toward a condemning limit, even with an acceptable wear metal, is a legitimate trigger for a fluid change.
An oxidation and nitration, often measured by FTIR spectroscopy, provides a direct assessment of a chemical degradation. Oxidation is accelerated by a high operating temperature — per the general rule in lubrication science, for every 10°C rise above the fluid's design operating temperature, the oxidation rate approximately doubles. A transmission operating in a mountain-grade hauling, heavy vocational service, or without a properly functioning cooler will degrade fluid significantly faster than an over-the-road linehaul application, and a sampling interval should reflect that difference.
An additive depletion monitoring tracks the reduction of a key additive component — an anti-wear agent, a friction modifier, a corrosion inhibitor — relative to the baseline chemistry of a fresh fluid sample. As these additives deplete, the fluid's ability to protect a clutch pack, control shift behavior, and prevent corrosion diminishes. This is especially relevant for a fleet using a synthetic fluid marketed with an extended drain interval: the fluid's base oil may remain serviceable while the additive package has been consumed well past the point of adequate protection.
Sampling Technique: Where Most Fleet Programs Break Down
Even a well-designed transmission fluid analysis program produces unreliable data when a sampling technique is poor. A sampling error is one of the most common reasons a fluid analysis result appears inconsistent or misleading, and it's entirely preventable with proper training and a standardized procedure.
The draw point matters significantly. A transmission fluid sample should be drawn from a location in the fluid circuit that's representative of the fluid in active circulation — not from the bottom of the pan where settled debris concentrates, and not from a return line immediately after a cooler where the fluid temperature and composition may not reflect the bulk fluid condition. Most transmission manufacturers and fluid analysis laboratories specify an approved sample point for their respective systems.
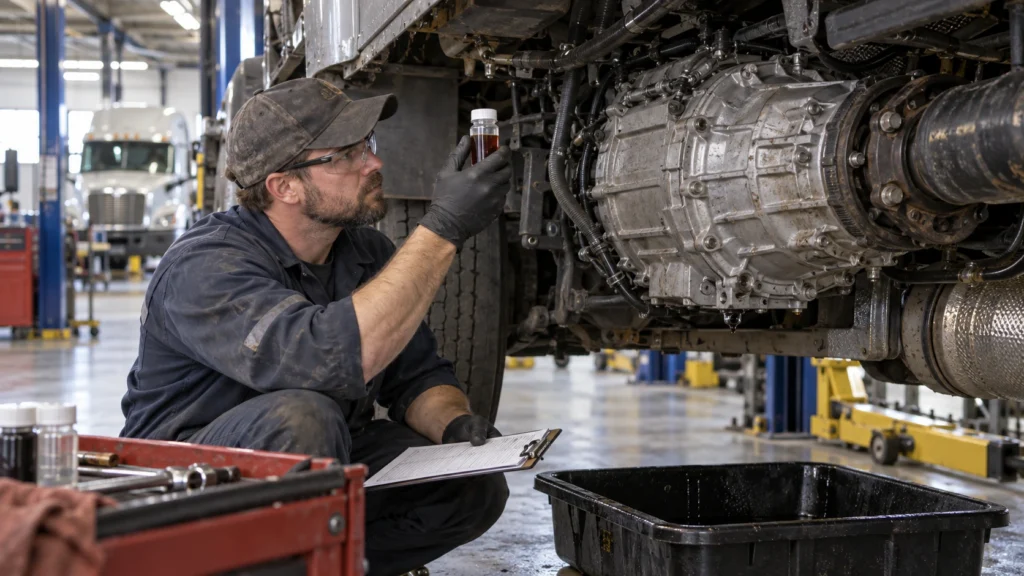
A vacuum pump sampling system is commonly used in a shop environment and can produce a reliable result when used correctly. The intake tube should be positioned appropriately within the fluid circuit — not dragged across the pan floor, which picks up years of settled debris that wildly inflates a wear metal reading. Use a clean, dedicated sample tubing for each sample. Reusing tubing from a previous sample, even if flushed, risks a cross-contamination that corrupts a result.
The sample container must be clean and free of any prior contaminant. Most fluid analysis laboratories provide a dedicated sample kit with a pre-labeled, sealed container for exactly this reason. Use the lab's supplied container rather than a generic shop bottle, and ensure the container is sealed immediately after sampling to prevent an atmospheric contamination.
Labeling accuracy is equally critical: the unit number, mileage, date, fluid type, hours on fluid since last change, and total miles or hours on the transmission must all be recorded correctly. A laboratory that applies the wrong accumulated hours to a sample can produce a dramatically incorrect condemning threshold — a garbage-in, garbage-out failure that can either miss a real problem or flag a healthy transmission for an unnecessary service.
Sample timing relative to operation also matters. Draw a transmission fluid sample when the fluid is at normal operating temperature — after the vehicle has been running under load, not cold from an overnight parking. A cold sample can produce a viscosity reading that doesn't reflect in-service behavior, and a wear debris that settles during a cold soak may not be fully suspended in the sample volume.

Building a Fleet-Wide Transmission Fluid Analysis Program
An effective fleet transmission fluid analysis program isn't a one-truck experiment — it's a systematic, documented maintenance process that generates comparable data across units and over time. Building that program requires a decision about which unit to include, how often to sample, which laboratory to use, what test package to specify, and how to act on the result.
Prioritizing Which Units to Include
Most fleets shouldn't start a transmission fluid analysis program by enrolling every unit simultaneously. Start with the highest-value or highest-risk transmission: a unit in severe-duty vocational service, a unit with high mileage approaching a major service milestone, a unit with a history of transmission issues, and a unit that carries the greatest downtime cost if it fails unexpectedly. HDJ's automated manual transmission maintenance guide covers how this prioritization fits into a broader AMT program.
As the program matures and produces reliable baseline data on the initial units, expand enrollment to the broader fleet. The per-sample cost is low enough that a comprehensive fleet-wide program is economically justifiable for most operations once the administrative process is standardized. Per 49 CFR Part 396.3, a motor carrier is required to maintain a systematic inspection, repair, and maintenance program for a commercial motor vehicle — a fluid analysis program with proper documentation contributes directly to that compliance record.
Setting Sample Intervals
A sampling interval should reflect the severity of the application, the drain interval for the fluid in use, and the criticality of the unit. For a standard over-the-road application using a synthetic ATF on a normal OEM-recommended drain cycle, sampling at each drain service or at an annual interval provides meaningful trending data without excessive program cost. For a severe-duty application — heavy haul, vocational work truck, mountain operation, or stop-and-go urban service — increase sampling frequency to every 25,000 to 30,000 miles or an equivalent operating hour.
Eaton's PS-386 synthetic transmission fluid specification, which covers an Eaton Fuller automated manual transmission (HDJ's Eaton Fuller transmission problems guide covers this platform in depth), and Allison's TES-295 approved fluid program (see HDJ's Allison transmission troubleshooting guide for platform-specific fluid intervals) both acknowledge that fluid life varies with operating conditions. When targeting an extended drain interval using an approved synthetic fluid, fluid analysis at the mid-point of the proposed extended interval provides the confirmation data needed to safely authorize the extension.
Selecting a Laboratory
For heavy-duty fleet transmission fluid analysis, laboratory selection should prioritize several factors beyond price. The laboratory should have an established database of heavy-duty transmission baseline data across the transmission models in your fleet — this is what enables a meaningful normal/abnormal comparison rather than a generic threshold table that doesn't account for a model-specific wear signature. Turnaround time matters operationally: a lab that takes two weeks to return a result limits your ability to act on a time-sensitive finding.
SAE has developed several standards relevant to lubricant testing and specification. Viscosity comparisons across samples rely on the ASTM D445 methodology already noted above, while SAE J311 covers the equipment and procedures specific to measuring ATF properties — a related but distinct document from SAE J2360, which is actually an axle and gear lubricant specification (the successor to the military MIL-PRF-2105E standard) rather than an ATF standard. Ask a prospective lab about its quality assurance certification and whether it provides a unit-specific trending report or only an individual sample report.
Documenting and Acting on Results
The final and most operationally important component of a transmission fluid analysis program is the decision-making process that turns a laboratory result into a maintenance action. This requires establishing in advance what result condition triggers what response — and ensuring that response protocol is followed consistently rather than left to individual technician judgment without guidance.
Key Recommendation
Document a response protocol for three trigger levels before starting your program: a "monitor" level (a result within normal range, continue current interval), a "watch" level (a result trending toward a limit, increase sampling frequency and inspect at the next service), and an "act" level (a result outside a condemning limit or showing a sudden spike, schedule inspection before the next planned maintenance). Share these protocols with your service team and ensure they're applied consistently.
Integrate a fluid analysis result into your fleet maintenance management system alongside other maintenance records. Cross-reference a fluid analysis finding with a fault code history, a driver-reported symptom, and an inspection record from the same unit — HDJ's heavy-duty truck clutch replacement guide is a useful reference when a fluid analysis finding needs correlating against clutch pack condition specifically.
A transmission fluid analysis showing elevated iron trending over three consecutive samples alongside a driver report of delayed engagement or harsh shifts is a significantly more actionable data picture than either data point in isolation.
Frequently Asked Questions
How often should transmission fluid be sampled for analysis in a commercial fleet?
For most heavy-duty automatic and automated manual transmissions operating under normal duty cycles, sampling once per year or every 50,000 to 75,000 miles is a reasonable starting point. A fleet running a severe-duty application — mountain grades, heavy haul, or stop-and-go urban routes — should increase frequency to every 25,000 to 30,000 miles. The key is consistency: the value of fluid analysis compounds with each sample because it enables a trend comparison over time.
What wear metals should fleet managers watch for in transmission fluid analysis results?
The primary wear metals in heavy-duty transmission fluid analysis are iron, copper, aluminum, tin, and lead. Iron indicates wear of a gear, shaft, bearing, or clutch plate. Copper is the most nuanced reading — it can indicate legitimate bearing or bushing wear, but in some Allison transmissions it's expected due to a sintered copper-alloy clutch pack, so it must be interpreted against the OEM's baseline data. Elevated sodium or potassium indicates a coolant entry — a serious condition requiring immediate investigation.
How much does transmission fluid analysis cost per sample?
A standard transmission fluid analysis typically ranges from $20 to $40 per sample, depending on the test package and laboratory used. A comprehensive package including elemental spectroscopy, viscosity, particle count, contamination screening, and ferrography can run $50 to $75. Against a full transmission rebuild — roughly $3,500 to $8,500 for most Class 8 units, or $8,000 to $15,000 for an installed replacement, plus towing and downtime — even the top-end sample cost is a small fraction of one prevented failure.
Can transmission fluid analysis extend fluid drain intervals?
Yes — fluid analysis is one of the primary tools for safely optimizing a drain interval beyond an OEM default. A modern synthetic transmission fluid, including Allison TES-295 and Eaton PS-386 approved fluids, is engineered for extended service life compared to a conventional fluid. Analysis lets you confirm the fluid's actual condition — viscosity, additive depletion, oxidation, and contamination — before authorizing an extended drain. Any extension must be data-driven and align with the OEM-specified condemning limit.
What is the difference between elemental spectroscopy and ferrography for transmission fluid?
Elemental spectroscopy (ICP-OES) measures a wear metal concentration in parts per million, but has a particle size limitation — it detects particles up to roughly 8 to 10 microns. This makes it excellent for detecting early-stage, fine-particle wear but less effective at catching large debris from a catastrophic or accelerating failure. Ferrography examines larger ferrous particles and their morphology. If spectroscopy shows elevated iron but ferrography shows low ferrous debris, the particles are small and likely normal — the reverse is a red flag.
Transmission fluid analysis for fleets works when it's treated as a systematic process rather than an occasional check. The data is only as useful as the program structure around it: consistent sampling, accurate documentation, meaningful trend comparison, and a defined action protocol — the same discipline Michael Nielsen and Heavy Duty Journal's editorial team hold every guide on heavydutyjournal.com to. Start with your highest-risk units, build the baseline, and let the trend data guide your decisions.
Share This Guide With Your Fleet Team
If this breakdown of transmission fluid analysis saved you time or clarified your predictive maintenance program, pass it along to a fleet manager or diesel tech who could use it.